
Executive Summary
The gap between having data and understanding it is now the defining constraint.
Private markets firms have invested heavily in systems of record: administrators, accounting platforms, portfolio tools. What they have not built is a system of understanding. The layer that connects fragmented data into defensible, timely, investor-ready communication is still largely manual, undocumented, and dependent on individuals who may not be there next quarter.
The consequences are no longer theoretical. In 2026, LP reporting expectations have materially tightened under new ILPA templates. DPI scrutiny has intensified as institutional LPs demand actual cash returns. Fundraising timelines have stretched to an average of 20 months, nearly double pre-pandemic norms. And the operational infrastructure inside most mid-market managers remains file-centric, person-dependent, and structurally fragile.
This report examines four interconnected challenges. First, the LP reporting burden and how reconciliation absorbs days of senior time before every quarterly pack goes out. Second, the structural inefficiency of capital call and distribution management and what it costs in time, accuracy, and LP trust. Third, the information gap facing investment teams and why 75% of GPs report that AI tools are ineffective for portfolio monitoring. Fourth, what it means when institutional knowledge walks out the door with a departing analyst. For each challenge, we set out what best-in-class firms are doing differently and what the cost of inaction looks like in concrete terms.
"We have the data, but it still takes too long to understand what's actually going on."
Persistent theme across CFO, COO and investment leadership conversations. Finela, 2025 to 2026
Section 01: Market Context
A $13 trillion industry with pre-institutional reporting infrastructure.
Global private capital AUM grew from approximately $4 trillion in 2010 to over $13 trillion by end-2024, driven by larger fund sizes, multi-strategy platforms, longer holding periods, and the rise of continuation vehicles and co-investment programmes. The operational infrastructure supporting that capital has not scaled at the same pace.
The challenge is not software absence. Most mid-market managers have fund administrators, portfolio management platforms, accounting systems, and business intelligence tools. The challenge is the reasoning layer that sits between them: the interpretation of capital flows, the reconciliation of NAV discrepancies, the translation of side letters, the explanation of variance to auditors and LPs. That layer remains overwhelmingly manual, undocumented, and person-dependent.
Three structural forces are now converging to make this model untenable. First, LP expectations around transparency and speed have fundamentally shifted. 74% of institutional LPs now rank DPI as their primary re-up criterion, up from 52% five years ago, and the pressure for granular, timely reporting has never been higher. Second, the ILPA Reporting Template v2.0 came into force in Q1 2026, representing the most comprehensive overhaul of industry reporting standards since 2011 and adding new reconciliation requirements across capital accounts, fees, and performance attribution. Third, fundraising timelines have stretched to an average of 20 months, meaning operational credibility is now assessed long before a first close, and reporting infrastructure is part of LP due diligence.
Section 02: LP Reporting
Without the burden of reconciliation.
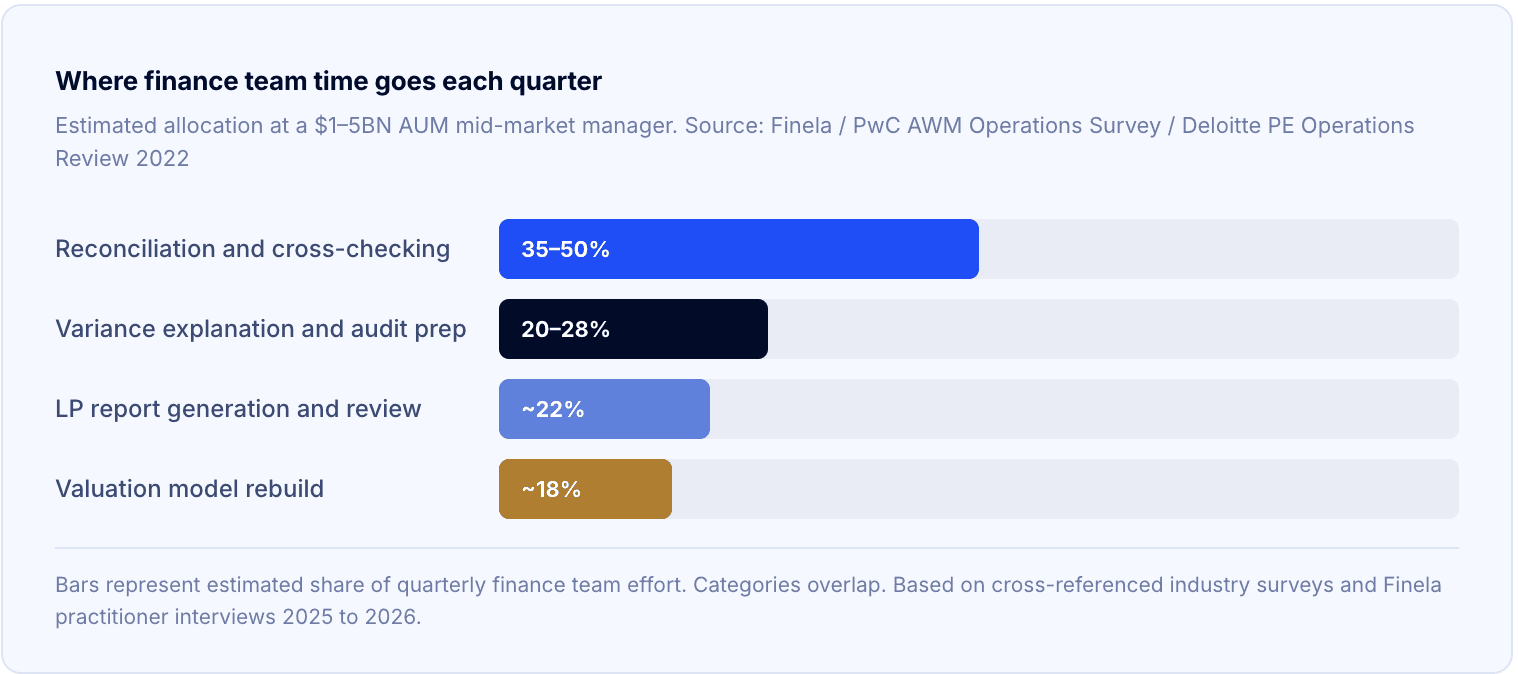
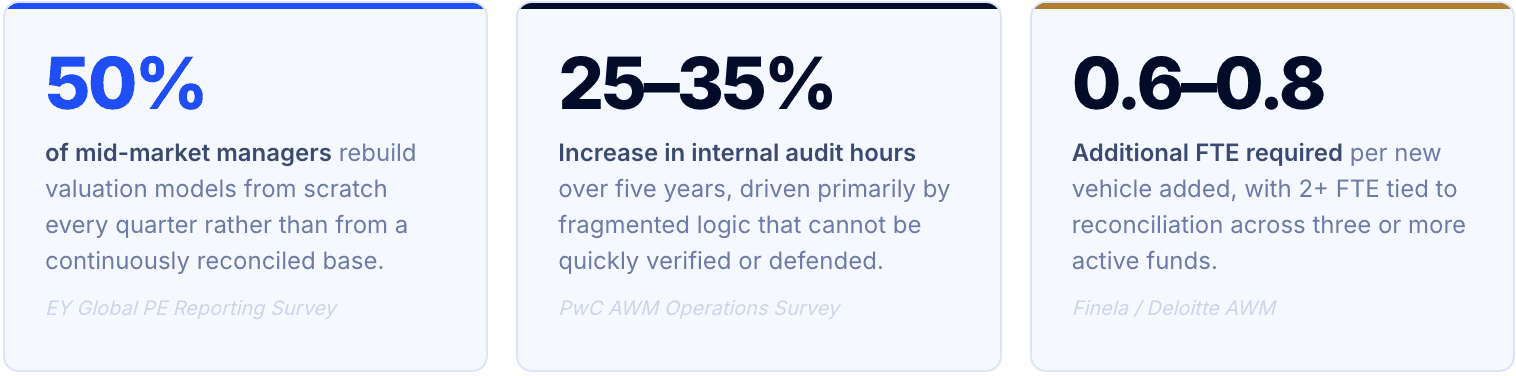
Before a quarterly report goes to investors, most ops and finance teams spend two to five days cross-checking data across systems. Numbers from the administrator, internal models, the valuation memo, and the portfolio management platform rarely align on first pass. The process of making them agree, identifying the source of discrepancy, determining which figure is correct, and updating the relevant models, consumes precisely the days when senior capacity is most needed for higher-value work.
The output is a set of numbers everyone uses but nobody fully trusts. That tension rarely appears in the quarterly pack itself, but it accumulates in the relationship with LPs over time. When an LP asks a follow-up question about a line in the report, and the answer takes three days to come back, the relationship absorbs a cost that has nothing to do with investment performance.
The reconciliation phase is where the structural problem is most visible. Data lives across the administrator's portal, internal Excel models, the portfolio platform, and email-based valuation correspondence. There is no single version of truth at the start of the process. Teams are not doing bad work. They are doing necessary work that should not exist: work that is entirely a function of fragmented data architecture rather than fund complexity.
The ILPA 2026 Implication
The updated ILPA Reporting Template v2.0, now effective for funds in their investment period as of Q1 2026, introduces more granular cash-flow classification, detailed management fee reconciliation, integrated carried interest reporting, and standardised performance attribution. KPMG's implementation guidance notes that mapping new data fields routinely exposes inconsistencies between systems and accounting standards, creating additional reconciliation work. For firms still running file-based reporting processes, compliance is not a software upgrade. It is an architectural change that surfaces every existing data fragmentation problem simultaneously.
Quarterly reporting cycle: where time is actually spent
Typical timeline at a $1–3BN AUM manager with 2 to 3 active vehicles. Days shown from quarter-end to LP delivery.
"ILPA-aligned reporting is becoming less of a differentiator and more of an expectation. Firms that invest in getting this right now will be better positioned for both upcoming reporting cycles and future fundraising efforts."
Eliassen Group. ILPA QRSI Implementation Guidance, March 2026
Section 03: Capital Activity and GP-LP Relations
Cleaner GP-LP relations start with cleaner capital data.
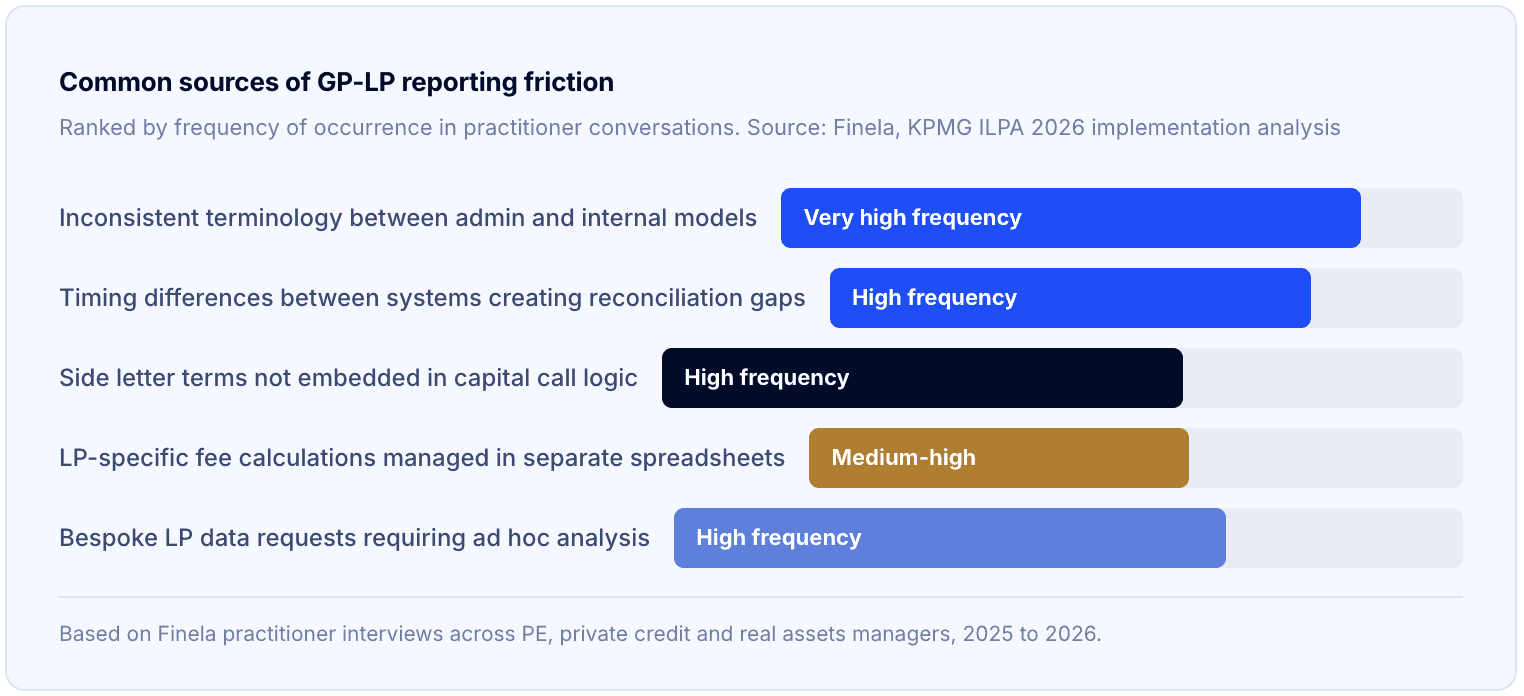
Capital calls, distributions, and investor updates arrive across emails, PDFs, and administrator statements, often with inconsistent terminology, varying classification conventions, and no single view of outstanding commitments. For the team managing LP relationships, this creates a persistent information disadvantage: you are never entirely certain that the position you are communicating to an investor is fully current, and you are never entirely certain that the figure in the email matches the figure in the model.
Capital call and distribution processing is one of the most logic-heavy processes in private markets. Each notice integrates staggered closings, fee offsets, recycling provisions, excuse LP mechanics, side letter overrides, and transfer activity. All of it must reconcile precisely before a notice goes out. The observed benchmarks for this process reveal how much invisible cost it carries:
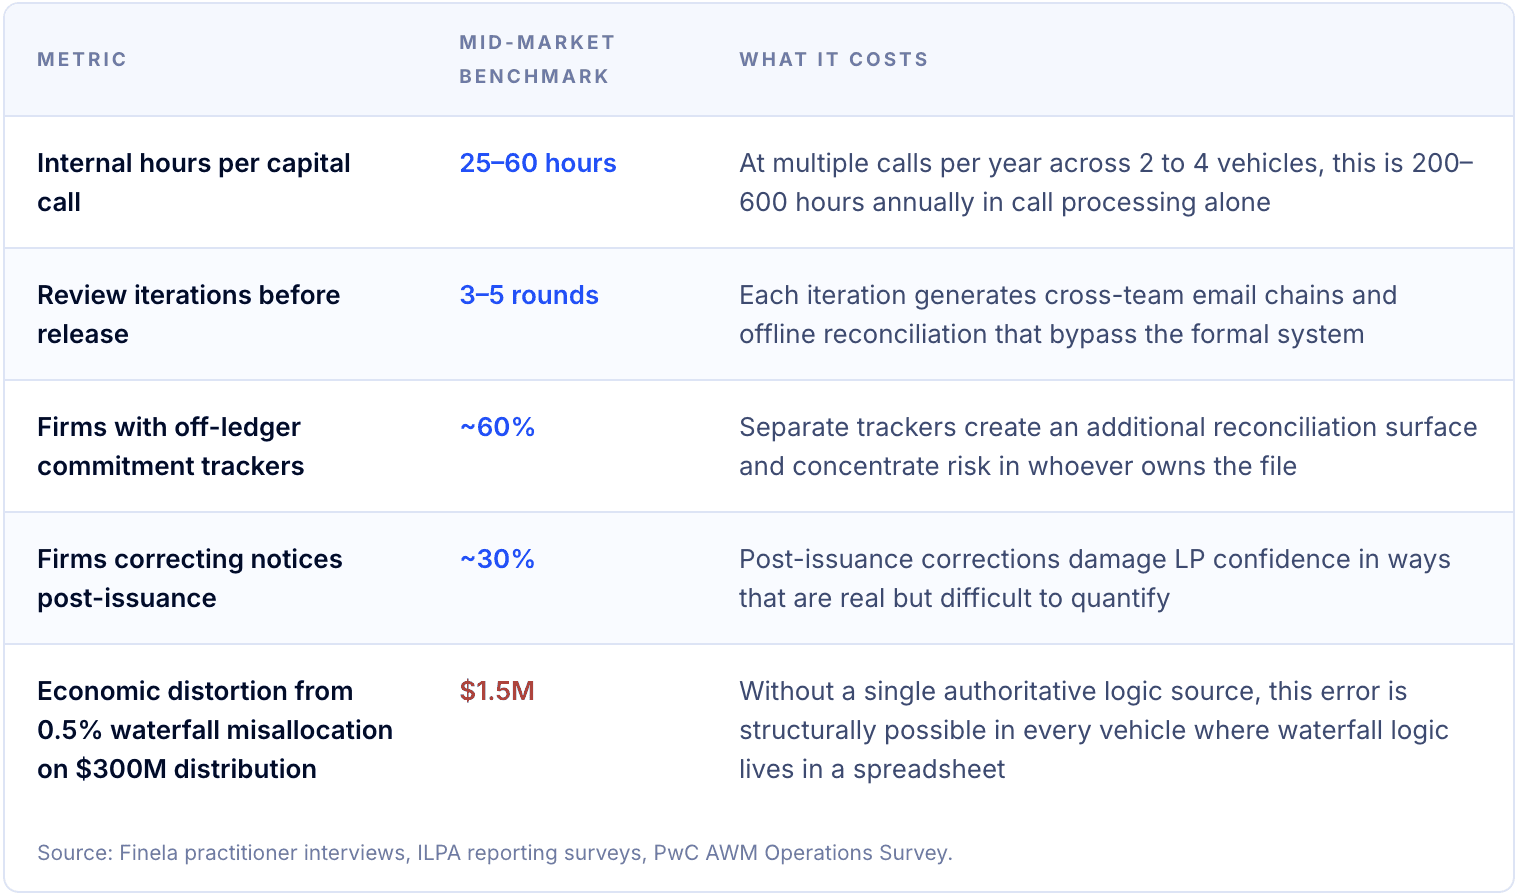
The ILPA Capital Call and Distribution Template, updated in 2025 and now in implementation, introduces standardised transaction types across calls and distributions aligned directly to the new Performance Template. The explicit goal is to reduce the reconciliation burden between call notices and performance reporting. But the transition itself surfaces the underlying problem: mapping new data fields consistently requires those fields to exist cleanly in the first place, and for most mid-market managers, they do not.
The consequence of this friction is felt most acutely during fundraising. According to Dechert's 2026 Global PE Outlook, 46% of GPs are now using GP-led secondaries or continuation vehicles to expedite distributions, nearly double the prior year. Each of those structures introduces additional reporting complexity, additional reconciliation surface, and additional demands on IR teams that are already stretched. The GPs who navigate this successfully are those who have built a continuously updated, accurate view of each LP's position. Not those who rebuild that view from scratch every quarter.
Section 04: Investment Teams and CIOs
The cost of making decisions on yesterday's data.
For CIOs and investment team heads, the intelligence gap has a different texture but the same root cause. Portfolio monitoring lags by days or weeks. IC preparations consume disproportionate resource on data assembly rather than insight generation. Variance explanations require ad hoc analysis rather than surfacing automatically.
S&P Global Market Intelligence's 2026 Private Equity survey found that 75% of GPs rate AI as ineffective for portfolio monitoring, and 60% report significant dissatisfaction with the quality of non-public operational metrics. The constraint is not tooling. It is that fragmented, unstructured data is being fed into tools that need clean, structured inputs. The tools perform exactly as designed. The problem is architectural.
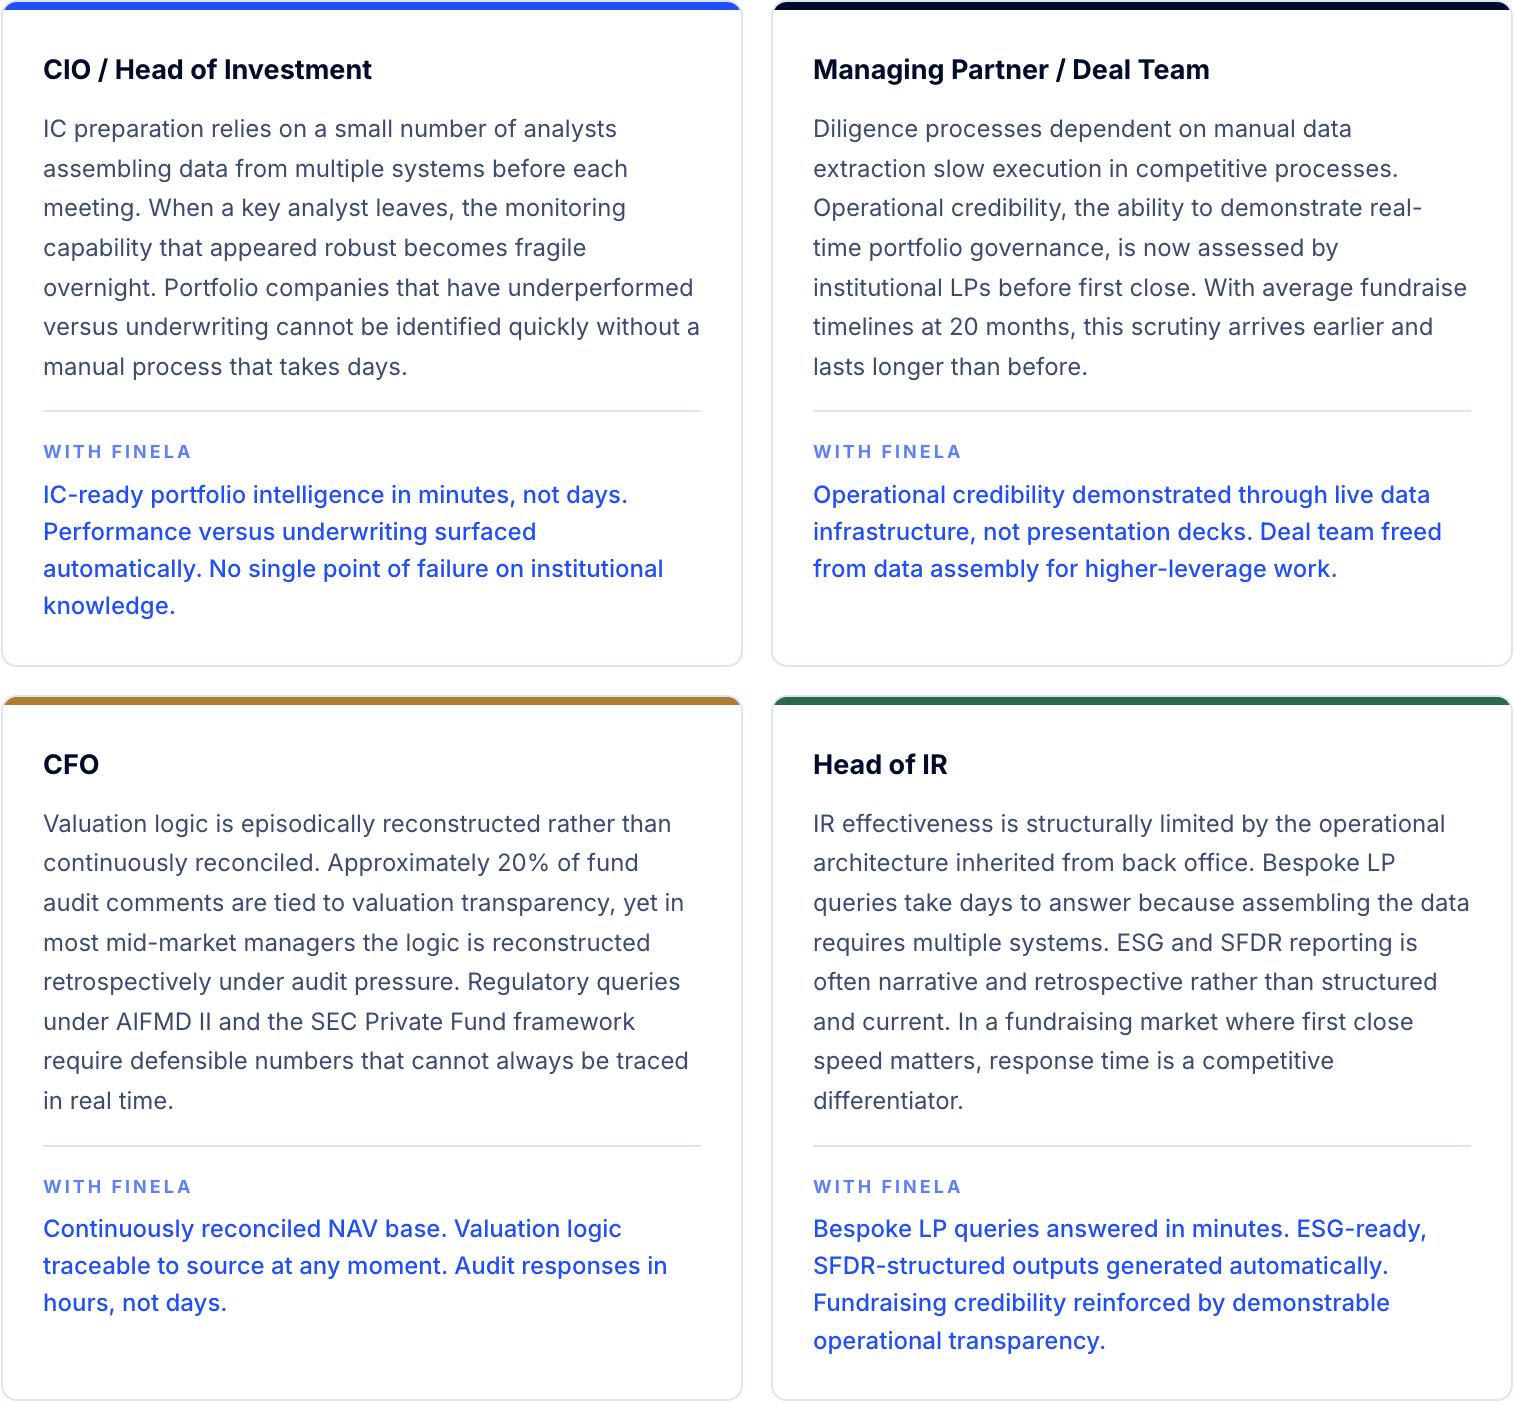
The Key-Person Problem
When the analyst who owns the portfolio tracker leaves, or the VP who carries the mental model of a complex holding moves to another firm, the intelligence gap widens overnight. This is not a talent problem. It is an architectural one. Operational reasoning that resides in individuals, their waterfall interpretations, their side letter knowledge, their understanding of why an IRR adjustment was made, represents institutional risk that traditional system upgrades do not address. The question is not whether your team is good. The question is whether your firm's intelligence survives the team.
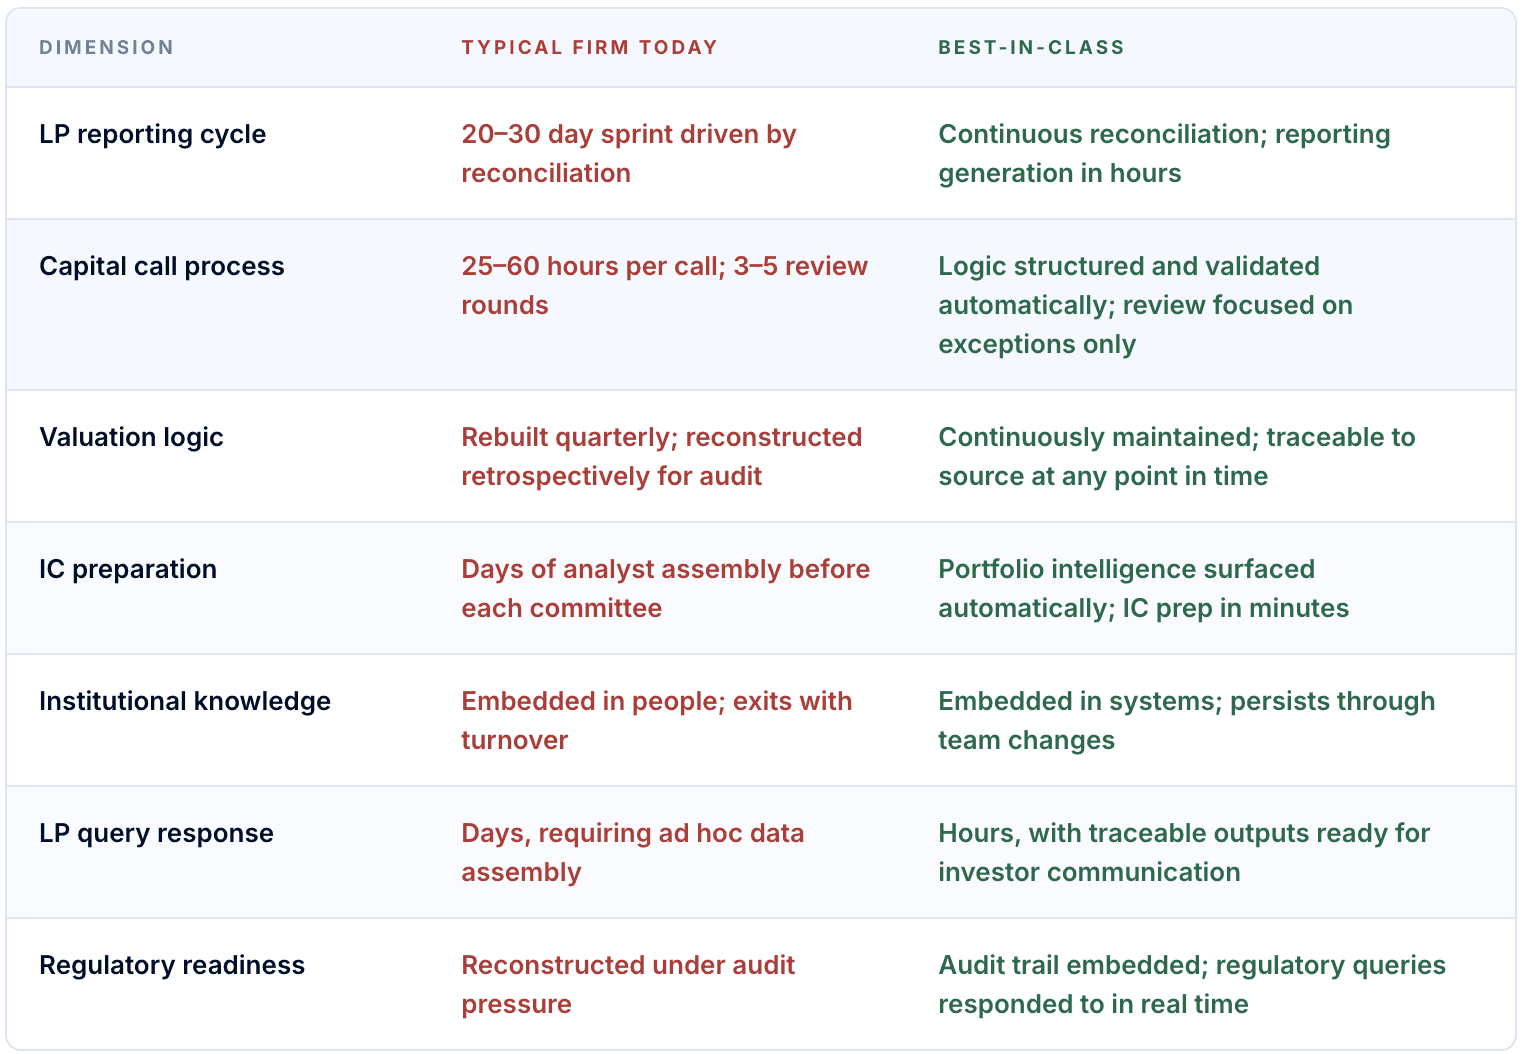
Section 05: The Shift
From systems of record to systems of understanding.
Leading private markets platforms share one consistent operational advantage: they minimise the cost of understanding. They do not rely on expanding spreadsheet ecosystems, heroics during reporting cycles, or institutional memory locked in individuals. Instead, they have built a layer above their existing systems that connects fragmented data into decision-grade intelligence: explainable, traceable, and not dependent on any single person.
This is not a replacement of existing infrastructure. Fund administrators, accounting systems, and portfolio management platforms remain in place. The intelligence layer sits above them, consuming their outputs and doing what they were never designed to do: reason across them, surface discrepancies, preserve context, and generate outputs that are immediately usable by teams without further manual assembly.
Section 06: Actionable Roadmap
What to prioritise, by role.
Operational transformation in private markets is not a single project. It is a sequence of decisions, each of which compounds. The single most valuable first step for any leadership function is a calibrated, peer-benchmarked view of where your firm stands today: specifically, the annual cost of current inefficiency in your specific context, by strategy and AUM.
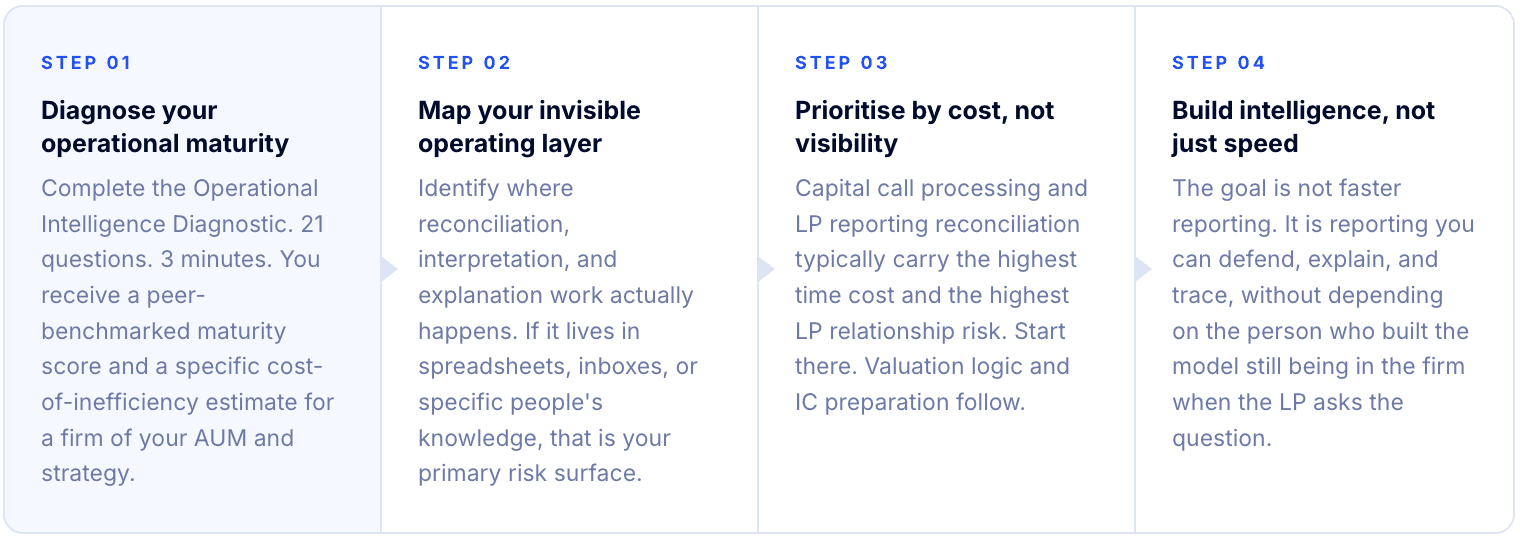
Where does your firm stand?
Finela's Operational Intelligence Diagnostic benchmarks your firm against comparable managers by strategy and AUM. You receive a maturity score, a peer comparison, and an estimated annual cost of current operational inefficiency specific to your firm size and structure. No forms. No sales call required.
Take the diagnostic: finela.ai/diagnostics
References
Preqin (2024). Global Private Capital AUM and Market Trends 2010 to 2024. preqin.com
ILPA (2025). Quarterly Reporting Standards Initiative: ILPA Reporting Template v2.0 and Performance Template. Effective Q1 2026. ilpa.org
ILPA (2024). LP Survey: DPI as Primary Re-Up Criterion. Cited in PipelineRoad PE Returns Statistics, 2026.
KPMG (2025). ILPA 2026: Preparing for the New LP and GP Standard in Private Market Reporting. kpmg.com
Katten Muchin Rosenman (2025). ILPA Updates Capital Call and Distribution Template. katten.com
S&P Global Market Intelligence (2026). 2026 Private Equity and Venture Capital Outlook. spglobal.com
McKinsey and Company (2026). Global Private Markets Report 2026. mckinsey.com
MSCI (2025). Private Capital in Focus: Trends to Watch for 2026. msci.com
Dechert (2025). GP-led Secondaries and Continuation Vehicles Boost DPI and LP Liquidity. dechert.com
Gen II Fund Services (2025). The Top Five Private Market Trends to Watch in 2026. gen2fund.com
Alter Domus (2026). 2025 Private Markets Year-End Review. alterdomus.com
PwC (2022). Asset and Wealth Management Operations Survey. pwc.com
Deloitte (2022). Private Equity Operations: Optimizing Infrastructure and People for Scale. deloitte.com
EY (2021). Global PE Reporting Survey: Valuation Transparency and Rebuild Cycles. ey.com
Finela (2025 to 2026). Practitioner interview series across PE, private credit, infrastructure and real assets managers. finela.ai/insights


