

EXECUTIVE SUMMARY: The Hidden Leverage Risk Inside Private Markets.
Private markets firms rigorously model financial leverage, entry multiples, and exit timing. Yet an equally material risk often remains unpriced and structurally unmanaged: operational leverage embedded in spreadsheet logic.
Across the lower- and mid-market private equity segment ($1bn–$10bn AUM), operational models remain overwhelmingly file-based. Capital accounts are reconstructed quarterly. Waterfalls are version-controlled manually. LP allocations depend on static trackers. Valuations are frequently rebuilt rather than continuously reconciled. This model was not irrational. It was adaptive to a previous era in which:
Funds were smaller
LP bases were simpler
Side letters were limited
Audit intensity was lower
Reporting timelines were longer
However, the institutional context has shifted dramatically.
According to Preqin (2023), private capital AUM has more than tripled since 2010. At the same time, regulatory oversight has intensified (see SEC Private Fund Adviser Rules, 2023), and LP reporting expectations have become more granular (see ILPA Reporting Guidelines).
Yet operational architecture inside many firms remains file-centric.
Industry Benchmark Indicators
(Compiled from Finela interviews + cross-reference to industry surveys)
35–50% of quarterly finance team time allocated to reconciliation and cross-checking
70%+ of firms maintain separate waterfall files per vehicle
1 in 5 mid-market managers report correcting a material LP reporting error within the past three years
Audit-related internal hours increased ~25–35% over five years (PwC AWM Operations Survey)
Operational headcount scales approximately 0.6–0.8 FTE per additional vehicle
The constraint is not software absence. It is that reasoning, the interpretation of capital flows, side letters, waterfall logic, allocation mechanics, remains manual and distributed.
This is operational leverage working in reverse.
WHERE WORK ACTUALLY HAPPENS: The Invisible Operating Layer.
Ask a COO where operational processes live and they will point to systems: fund administrators, accounting platforms, portfolio tools.
Ask their teams where work actually happens and the answer is more candid: inboxes and spreadsheets. The most critical operational reasoning in private markets occurs between systems:
Reconciling capital calls against commitment trackers
Interpreting side letters prior to allocation
Explaining valuation shifts to auditors
Adjusting IRR timing logic
Investigating NAV discrepancies
This layer is rarely formalized. It is:
Undocumented
Distributed
Person-dependent
Non-version-controlled
According to Deloitte’s Private Equity Operations Review (2022), process fragmentation is one of the top three scaling risks for mid-market managers.
Operational Benchmark Example.
For a $5bn AUM firm with 3–4 active funds:
600–900 internal hours per quarter are allocated to:
Cross-checking numbers
Rebuilding models
Audit preparation
Variance explanation
Approximately 15–25% of this work represents duplicated reconciliation.
This is not inefficiency. It is structural fragmentation.
THE MOST DANGEROUS SPREADSHEET: The Waterfall.
The distribution waterfall is where economic reality crystallizes:
Return of capital
Preferred return
Catch-up
Carried interest
Clawback
It is also where spreadsheet fragility becomes most acute.
Industry interviews reveal:
~70% of firms manually adjust waterfall logic at least once per lifecycle
40% maintain “shadow carry” projections
10% have restated carry internally due to formula or timing errors
While Excel is computationally powerful, it lacks:
Structured rule validation
Controlled logic versioning
Centralized logic governance
Real-time consistency checks
A 0.5% misallocation on a $300m distribution equals $1.5m of economic distortion.
The risk is not merely arithmetic. It is epistemic: no single authoritative logic source exists.
Risk Vector | Spreadsheet Environment | Structured Logic Environment |
Logic control | File versioning | Central rule repository |
Overrides | Hard-coded | Logged & validated |
Edge-case testing | Manual | Scenario simulation |
Audit traceability | Reconstructed | Embedded |
Capital Call & Commitment Tracking: Precision Under Pressure.
Capital calls appear procedural. In reality, they are one of the most logic-heavy processes in private markets.
Each notice integrates:
Staggered closings
Fee offsets and step-downs
Organizational expense true-ups
Recycling provisions
Excuse LP mechanics
Transfer activity
Side letter overrides
As regulatory scrutiny increases (see SEC Private Fund Adviser Rules, 2023) and LP transparency expectations rise (ILPA Reporting Guidelines), tolerance for allocation errors has narrowed significantly.
Yet in many mid-market firms, capital logic is distributed across files.
Operational Reality Snapshot.
(Based on industry interviews + cross-reference to ILPA, PwC AWM Ops Survey)
Metric | Mid-Market Benchmark |
Internal hours per capital call | 25–60 |
Review iterations before release | 3–5 |
Firms with off-ledger commitment trackers | ~60% |
Firms correcting notices post-issuance | ~30% |
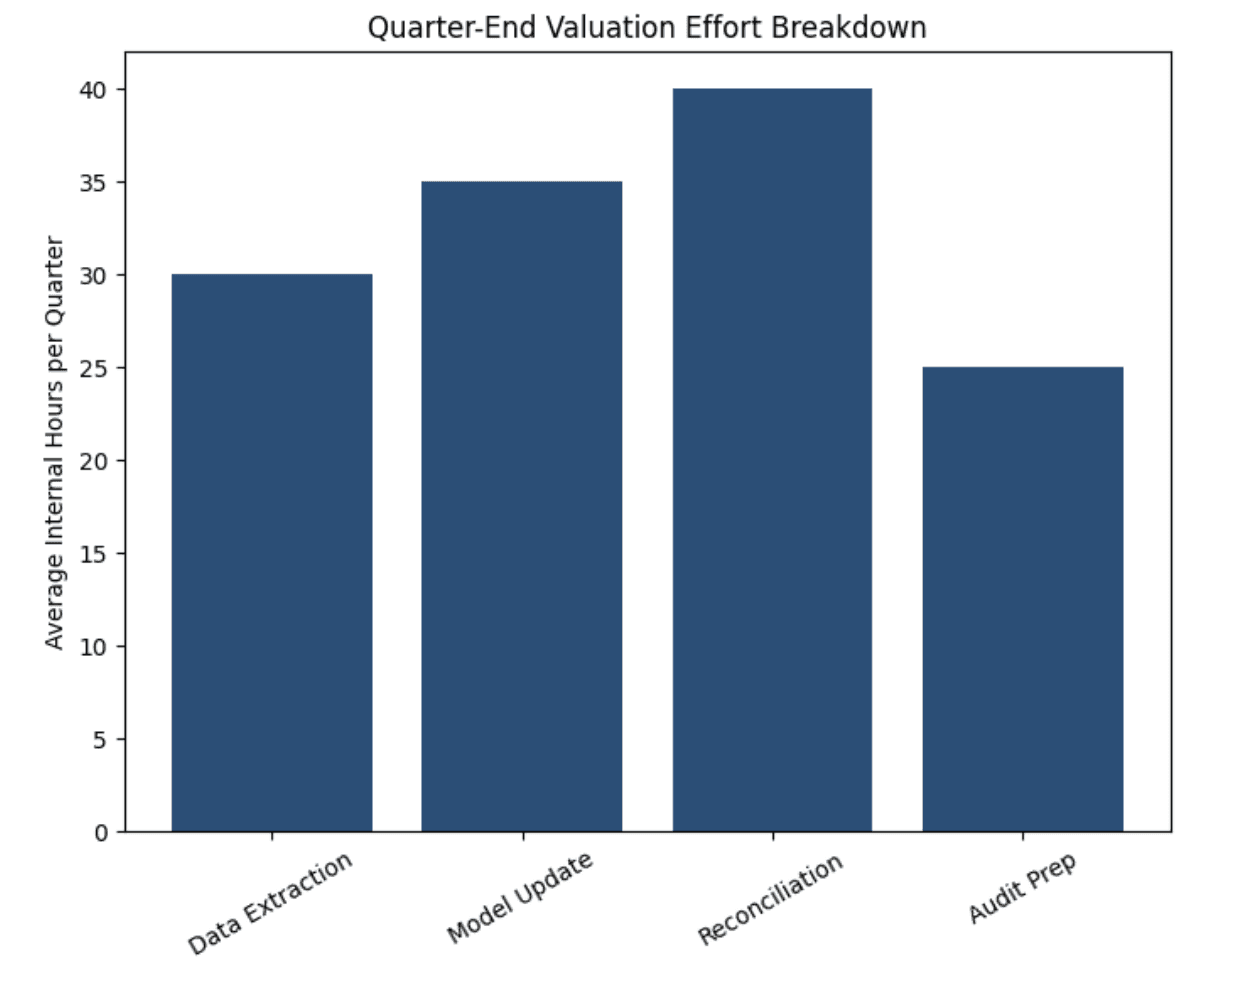
Quarterly Valuation & NAV: The Rebuild Cycle.
Quarter-end valuation is where spreadsheet dependency becomes most visible.
Finance teams often rebuild logic each quarter:
Extract portfolio data
Update comparables
Reconcile debt & FX
Recompute IRR
Re-validate cash-flow timing
According to EY Global PE Reporting Survey:
Finding | % of Firms |
Rebuild valuation models quarterly | ~50% |
Audit comments tied to valuation transparency | ~20% |
Adjust IRR post-initial calc due to timing errors | 10–15% |
The issue is architectural.
NAV logic is episodically reconstructed, not continuously reconciled.
The True Cost of Spreadsheet Dependency.
Spreadsheet dependency creates three structural ceilings:
Key-Person Risk.
Operational logic often resides in:
Analyst-built waterfall files
Controller-owned capital trackers
Email-based side letter interpretation
PwC AWM identifies undocumented process dependencies as a top operational risk in private asset managers.
Audit Intensity.
Internal audit support hours per fund have increased approximately 25–35% over five years (PwC, Deloitte AWM insights).
Fragmented logic increases audit friction.
Scaling Friction.
Observed staffing pattern:
Incremental Vehicle | Additional Ops Load |
+1 fund | 0.6–0.8 FTE |
+3 funds | 2+ FTE tied to reconciliation |
For a $5bn manager:
$400k–$750k annual internal cost tied to duplication, Indirect opportunity cost significantly higher.
The Provocation: Excel Is No Longer a Neutral Tool.
Excel built private markets.
It was flexible, adaptable, and sufficient when complexity was bounded.
Today’s environment is different:
Multi-vehicle structures
Continuation funds
Co-invest programs
Increasing side letter complexity
Compressed reporting cycles
Heightened regulatory scrutiny
The risk is not Excel itself. It is unstructured operational logic.
Comparison Table.
Dimension | File-Based Model | Structured Logic Model |
Logic storage | Individual files | Centralized engine |
Version control | Manual naming | Controlled revisions |
Exception handling | Hard-coded | Rule-based |
Audit traceability | Reconstructed | Embedded |
Key-person dependency | High | Reduced |
The firms that scale cleanly will treat operational reasoning as infrastructure, not analyst output.
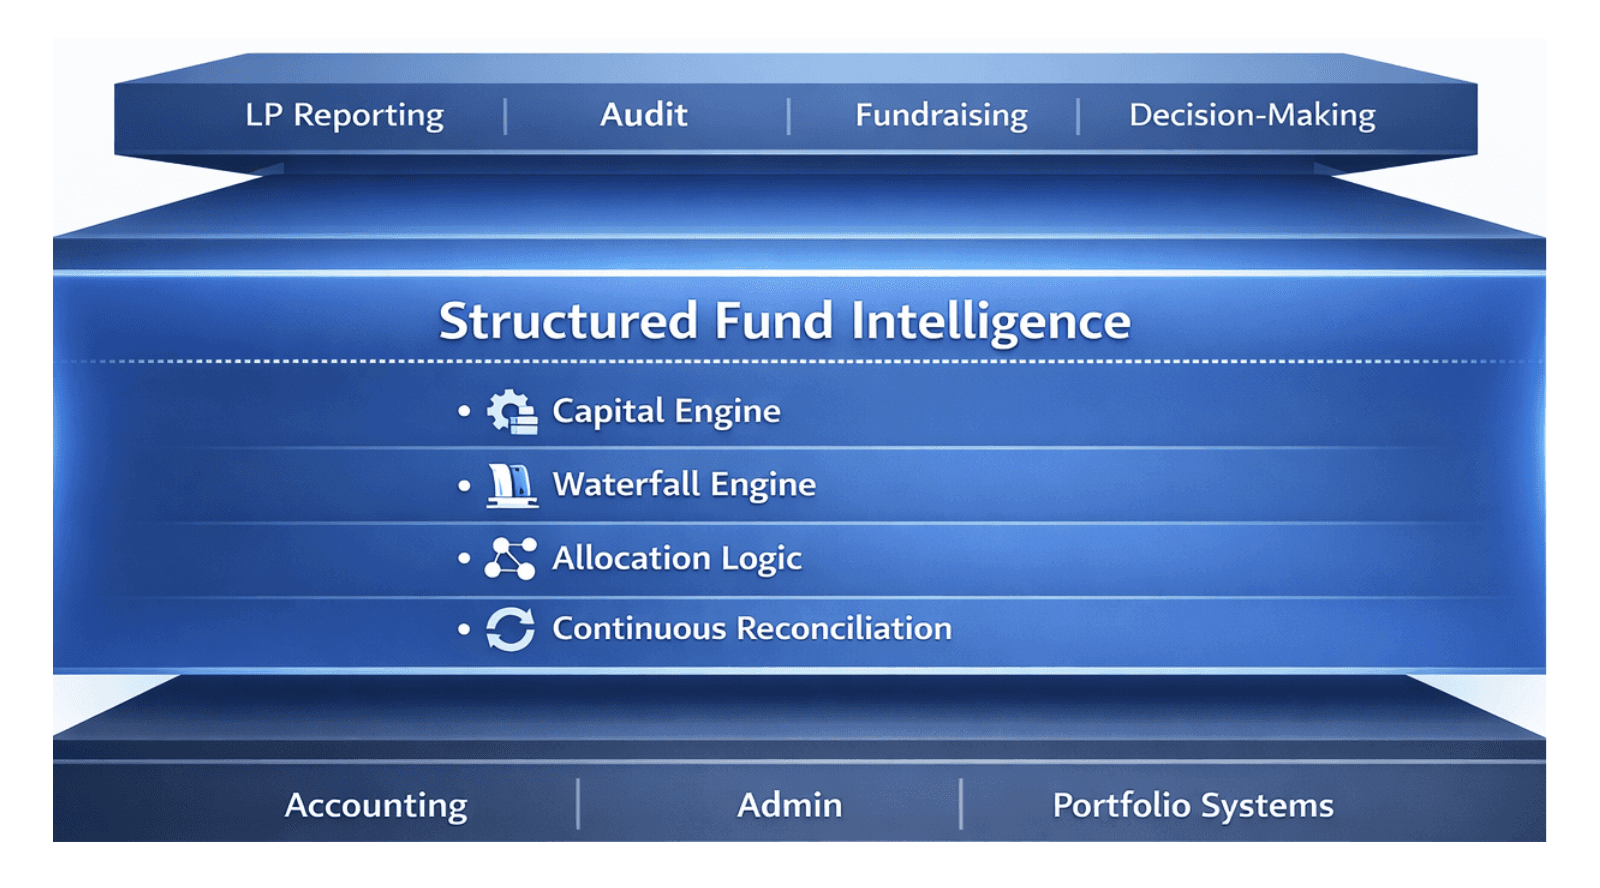
From Files to Fund Intelligence: The Shift Underway.
The next operational evolution is not another dashboard.
It is the institutionalization of fund logic.
A modern operating architecture requires:
Centralized capital account ledger
Structured waterfall engine
Embedded side letter translation
Continuous reconciliation across capital & NAV
Explainable reasoning layer
The Intelligence Stack.
Observed Impact.
Impact Area | Observed Range |
Reduction in reconciliation time | 30–50% |
Reduction in audit back-and-forth | 20–40% |
Reduction in key-person exposure | Material |
Improvement in LP confidence | Qualitative but significant |
This is not incremental efficiency. It is structural leverage.
“Tomorrow’s funds won’t just be managed, they will be intelligently orchestrated.”
Finela provides a secure intelligence and operating layer that sits above existing fund systems, enabling leaders to reason across data, governance, and context in a single, explainable workspace.


